
What if the laws of physics as we know them were wrong? Not in some minor detail, but in something fundamental. That is one of the two possible conclusions that emerge from the most recent data on the large-scale universe: either there is a completely unknown energy component, or our physics needs to be rebuilt from its foundations. In either case, artificial intelligence is at the center of how we are arriving at that answer.
In the seminar held on November 20, 2025, Jaime Forero-Romero, Associate Professor in the Department of Physics at Universidad de los Andes, presented the current state of this problem: how to map the universe on a large scale, what that map tells us about its composition and fate, and how artificial intelligence has become indispensable at every step of the process.
A Map Where Every Point Is a Galaxy
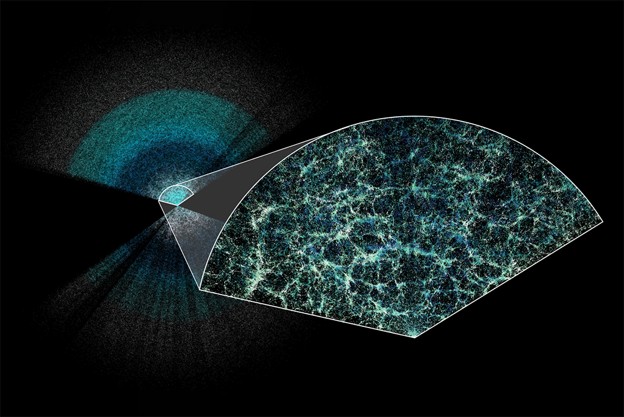
Jaime’s core work consists of building maps of the universe. Real three-dimensional maps where each point represents an entire galaxy, and the whole Milky Way fits into less than a pixel. These maps are constructed using spectroscopic telescopes that measure the redshift of millions of galaxies, making it possible to infer their distance and locate them in space.
The key instrument is the Dark Energy Spectroscopic Instrument (DESI), a next-generation survey located in Arizona. DESI consists of three components: 5,000 small robots, each with an optical fiber at its tip, mounted on a telescope that captures light from galaxies, along with a spectrograph that breaks that light down and records the information. The result is tens of millions of spectra—more than everything accumulated in the entire previous history of astronomy. Its findings have made the front pages of Le Monde and The Economist.
Observing with DESI is not a matter of sitting beside the telescope and looking through the eyepiece. It means spending the night watching terminals with graphs and Python pipelines running, verifying that the data are coming out correctly, and deciding which command to execute next. Twenty-first-century observational cosmology is, therefore, a data science.
Redshift: How We Measure the Universe
To build these maps, the key concept is redshift. When light from a galaxy passes through a spectrograph, it is broken down into its wavelengths, revealing dark lines characteristic of elements such as hydrogen. If those lines are shifted toward longer wavelengths compared to where they should be according to quantum mechanics, we say that the galaxy has a redshift Z, where

The interpretation is not, as one might think, that galaxies are moving away from us as in the Doppler effect. The correct interpretation is that spacetime itself is expanding. If you run that movie backward, you arrive at a point of almost infinite density: the Big Bang. This was the conclusion of Hubble’s famous graph, created nearly 100 years ago with only about twenty data points, and which laid the foundations of modern cosmology.
Dark Energy: Constant or Not?
In the late twentieth century, by measuring the brightness of supernovae at different distances, a group of astronomers discovered that the universe is not only expanding, but doing so at an ever-increasing rate. They received the 2011 Nobel Prize in Physics for that discovery. Explaining this acceleration requires one of two possibilities: either there is an unknown component of the universe (dark energy) that acts as a repulsive pressure, or the laws of physics are wrong on cosmological scales.
Since then, the standard model has assumed that dark energy is a constant: the same everywhere and at all times, like a horizontal line on a graph of density versus time. What the DESI data are suggesting is that this line is not straight—that is, dark energy may vary over time. Since that result was published, approximately two or three theoretical papers per day have appeared proposing explanations. The paper has already accumulated nearly 1,000 citations in a single year.
It is worth not confusing dark energy with dark matter, two distinct concepts. Dark matter has gravity, forms clumps called halos, and every galaxy resides within one of them. Dark energy does not form structures; it is distributed homogeneously throughout space. Neither is fully understood: dark matter has never been detected in particle accelerators, and dark energy challenges fundamental physics. In any case, either path—a new component or incorrect physics—represents a profound frontier of knowledge.
The Frozen Sound Waves of the Early Universe
One of the phenomena sought in these maps is Baryon Acoustic Oscillations (BAO). In the early universe, there was a hot, dense plasma permeated by sound waves—density perturbations that propagated at enormous speeds. As the universe expanded and cooled, these waves became “frozen,” leaving a statistical imprint on the distribution of galaxies that we observe today.
This imprint is detected as an excess probability of finding pairs of galaxies separated by a specific distance, one that can be calculated from relativistic physics. This known-size “standard ruler” makes it possible to measure cosmic distances and reconstruct how the universe’s expansion rate has evolved over time. It is precisely the method that DESI uses to determine whether dark energy varies with time.
The Central Problem: Large-Scale Inference
The fundamental challenge of observational cosmology can be stated as follows: given an observed universe (a map of galaxies), we want to infer the physical parameters that generated it. It is a massive, high-dimensional inverse problem. We start from what is observed and work backward to the recipe: what initial distribution of matter and energy, under what physical laws, produced what we see. And that is where artificial intelligence comes in.
The exponential growth of data makes this inevitable. In the 1980s, the state of the art was obtaining thousands of spectra. By 2000, hundreds of thousands. In 2010, one million. DESI will push that number to tens of millions. What a previous experiment achieved in five years, DESI can do in a single month, thanks to its 5,000 robots and automated processing on supercomputers. Handling that volume without machine learning is impossible.
Three Uses of AI in DESI
The DESI survey includes three families of artificial intelligence projects applied to the data, developed within Jaime Forero’s research group:
Este trabajo, iniciado por el estudiante doctoral John con 1,7 millones de espectros, fue continuado por Valeria Torres Gómez, estudiante de doble programa de física e ingeniería de sistemas, ahora con acceso a 52 millones de espectros del survey completo. El pipeline corre de forma masivamente paralela en NERSC, una de las supercomputadoras más potentes del mundo, ubicada en Berkeley, y permite analizar 50 millones de espectros de un día para el otro.
¿Para qué sirven los outliers? En su mayoría revelan fallas del instrumento: fluctuaciones en las CCD, errores en el pipeline, datos contaminados. Identificarlos permite «limpiar» el mapa y garantizar que cada punto es confiable. Aunque parezca un problema secundario, reducir la basura en el mapa, incluso en un 1%, es crítico para la inferencia estadística de parámetros cosmológicos: cada fuente de incertidumbre eliminada mejora la precisión de las conclusiones. En algunos casos, además, los outliers son genuinamente atípicos desde el punto de vista astrofísico y merecen investigación propia.
Usando redes neuronales convolucionales entrenadas con los datos etiquetados de DESI, el grupo logró hacer exactamente eso: inferir el redshift de galaxias en regiones donde solo existen imágenes. Compararon dos enfoques: ingeniería de features manual versus pasar el espectro completo a la red. La red convolucional sobre el espectro completo dio mejores resultados.
El enfoque del grupo fue construir un grafo sobre las posiciones de las galaxias, usando específicamente el grafo beta skeleton, popular en reconocimiento visual por seguir la conectividad que el ojo humano percibe como filamentos y, usar las propiedades de ese grafo como features de entrada a un Random Forest. El modelo, entrenado en simulaciones cosmológicas, predice si una galaxia está en un filamento, un nodo, un vacío u otra región de la red cósmica.
An Important Message: AI Is Not Infallible
Jaime Forero-Romero was emphatic on one point: in cosmology, no AI-based result is accepted without independent confirmation. Whether through visual inspection by a human expert or through an alternative statistical method, every finding must be validated before it can be considered scientifically robust. AI is deeply integrated into every stage of the DESI pipeline—from instrument-level data processing to the interpretation of cosmological maps—but always as a tool that requires oversight, not as an oracle.
Conclusion
The work presented in this seminar illustrates how modern cosmology is, at the same time, fundamental physics, data engineering, and machine learning. DESI’s results, which suggest that dark energy is not constant, would not have been possible without massive processing pipelines, dimensionality reduction, convolutional neural networks, and graph-based classifiers. At the same time, the challenges posed by cosmology—such as high dimensionality, noisy data, and large-scale inverse inference—are pushing the limits of what AI can do.
The fundamental question remains open: what is dark energy? Does it vary over time? Or are we facing the collapse of physics as we know it? The answer, if it comes, will emerge from maps of galaxies analyzed with algorithms that we are only beginning to master today.
This blog post summarizes the seminar “Cosmology to the Extreme: Artificial Intelligence for Mapping the Universe on a Large Scale,” presented by Jaime E. Forero-Romero on November 20, 2025, as part of the Quantil Applied Mathematics seminar series. The full video is available on the Quantil YouTube channel.
Get information about Data Science, Artificial Intelligence, Machine Learning and more.
In the Blog articles, you will find the latest news, publications, studies and articles of current interest.